


Retail Natural Gas Markets
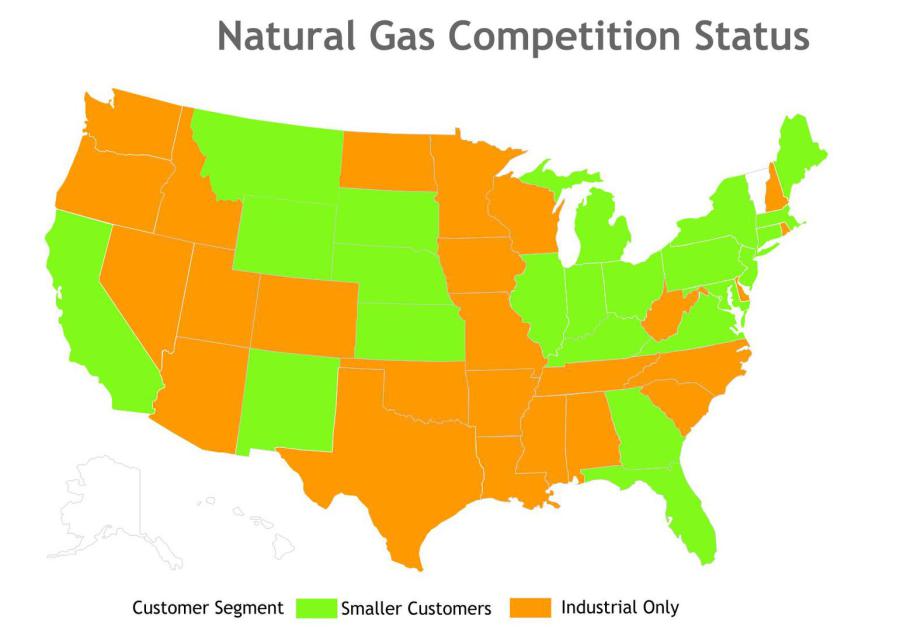 Figure 2. Natural Gas Choice Market Eligibility by Segment
Updated October 21, 2015.
ERCG estimates for 2013 --
- U.S. total competitively served sales of 1,869 Bcf and 7.9 million customers
- with a residential total of 718 Bcf and 7.1 million customers
- with a commercial total of 1,151 Bcf and 0.8 million customers
Mergers and acquisition (M&A) activity --
- in 2013, there were 12 total M&A deals for retail gas suppliers
- in 2014, there were 7 M&A deals
- in 2015 so far, there have been 7 M&A deals
The tables below show the 22 U.S. jurisdictions that have restructured retail gas markets. Rank is based on 2013 competitively supplied sales volume, using the most recently available data from the state utility commission migration reports. Contact info@ercg-us.com for more details on ranking methodology, as well as historical and forecasted sales (2010 to 2020) by state and utility.
Table 4. Residential State Gas Rankings, Sales, Customers
State or Jurisdiction |
Resi Rank |
Resi Sales (Bcf) |
Resi Customers (000s) |
California |
9 |
18.8 |
283 |
Connecticut |
16 |
2.2 |
1 |
District of Columbia |
15 |
3.3 |
17 |
Florida |
18 |
0.3 |
14 |
Georgia |
3 |
104.7 |
1,428 |
Illinois |
5 |
55.8 |
288 |
Indiana |
12 |
7.2 |
81 |
Kentucky |
17 |
2.0 |
25 |
Maryland |
8 |
21.5 |
247 |
Massachusetts |
10 |
15.6 |
3 |
Michigan |
4 |
58.8 |
443 |
Montana |
19 |
0.0 |
0 |
Nebraska |
13 |
5.1 |
68 |
New Jersey |
7 |
22.5 |
258 |
New Mexico |
20 |
0.0 |
0 |
New York |
2 |
123.7 |
922 |
Ohio |
1 |
234.5 |
2,591 |
Pennsylvania |
6 |
29.5 |
322 |
Virginia |
11 |
8.7 |
68 |
Wyoming |
14 |
3.5 |
41 |
Table 5. Commercial State Gas Rankings, Sales, Customers
State or Jurisdiction |
Comm Rank |
Comm Sales (Bcf) |
Comm Customers (000s) |
California |
3 |
127.3 |
57 |
Connecticut |
13 |
19.6 |
7 |
District of Columbia |
14 |
13.9 |
3 |
Florida |
21 |
4.1 |
3 |
Georgia |
10 |
46.5 |
90 |
Illinois |
4 |
120.4 |
53 |
Indiana |
12 |
23.7 |
18 |
Kentucky |
18 |
5.1 |
4 |
Maine |
19 |
4.7 |
2 |
Maryland |
8 |
50.9 |
24 |
Massachusetts |
9 |
46.8 |
18 |
Michigan |
7 |
80.1 |
37 |
Montana |
16 |
9.3 |
1 |
Nebraska |
17 |
8.4 |
12 |
New Jersey |
5 |
111.4 |
52 |
New Mexico |
15 |
11.5 |
4 |
New York |
1 |
195.0 |
133 |
Ohio |
2 |
151.5 |
228 |
Pennsylvania |
6 |
88.7 |
55 |
South Dakota |
22 |
2.2 |
0 |
Virginia |
11 |
25.5 |
11 |
Wyoming |
20 |
4.3 |
6 |
Table 6. State Public Utility Commission Date Update - Gas
|
|
|
|
|
|
|
State or Jurisdiction |
PUC Update |
|
|
|
District of Columbia |
Jun-15 |
|
|
|
Illinois |
Jun-15 |
|
|
|
Maryland |
Dec-14 |
|
|
|
Michigan |
May-15 |
|
|
|
Nebraska |
Apr-15 |
|
|
|
New Jersey |
Apr-15 |
|
|
|
New York |
Apr-12 |
|
|
|
Ohio |
Mar-15 |
|
|
|
Pennsylvania |
Mar-15 |
|
|
|
Wyoming |
Apr-15 |
|
|
|
|
|
|
Contact Us Today!
For more information, contact Young Kim, Principal at ERCG
Phone: (617) 903-0877
E-mail: info@ercg-us.com
ERCG sat down with leaders of dozens of ABC firms to get their insights on the market and how to build a successful business